One method for every record.
OXrun labels each record as live or backtest, calculates every strategy with one method, and scores how likely the results are to repeat.
84
Real Yield Dynamic AllocationRobustness score, out of 100
- Statistical evidence100
- Overfitting risk100
- Consistency over time100
- Live evidence2
- Implementability92
Where the numbers come from
 eToro account
 Hyperliquid vaultBacktest
One methodSame costs, same metrics, same score
A public pageLabelled live or backtest
- Live recordsRead directly from the trading platform, such as eToro or Hyperliquid, through read-only access, with the real fees. Owners cannot edit them.
- BacktestsA is hypothetical. OXrun runs the strategy on past prices with a cost model. Owners cannot upload results.
- One methodEvery strategy is calculated the same way: the same cost model, the same metrics and the same robustness score.
- Backtests score lowerThey are weaker evidence than live trading, so a backtest alone cannot reach the top of the robustness score.
- Reference strategiesBuy-and-hold baselines, such as the S&P 500 (SPY), the Nasdaq-100 (QQQ) and a 60/40 stock and bond mix, give every result something to compare with.
How robustness is scored
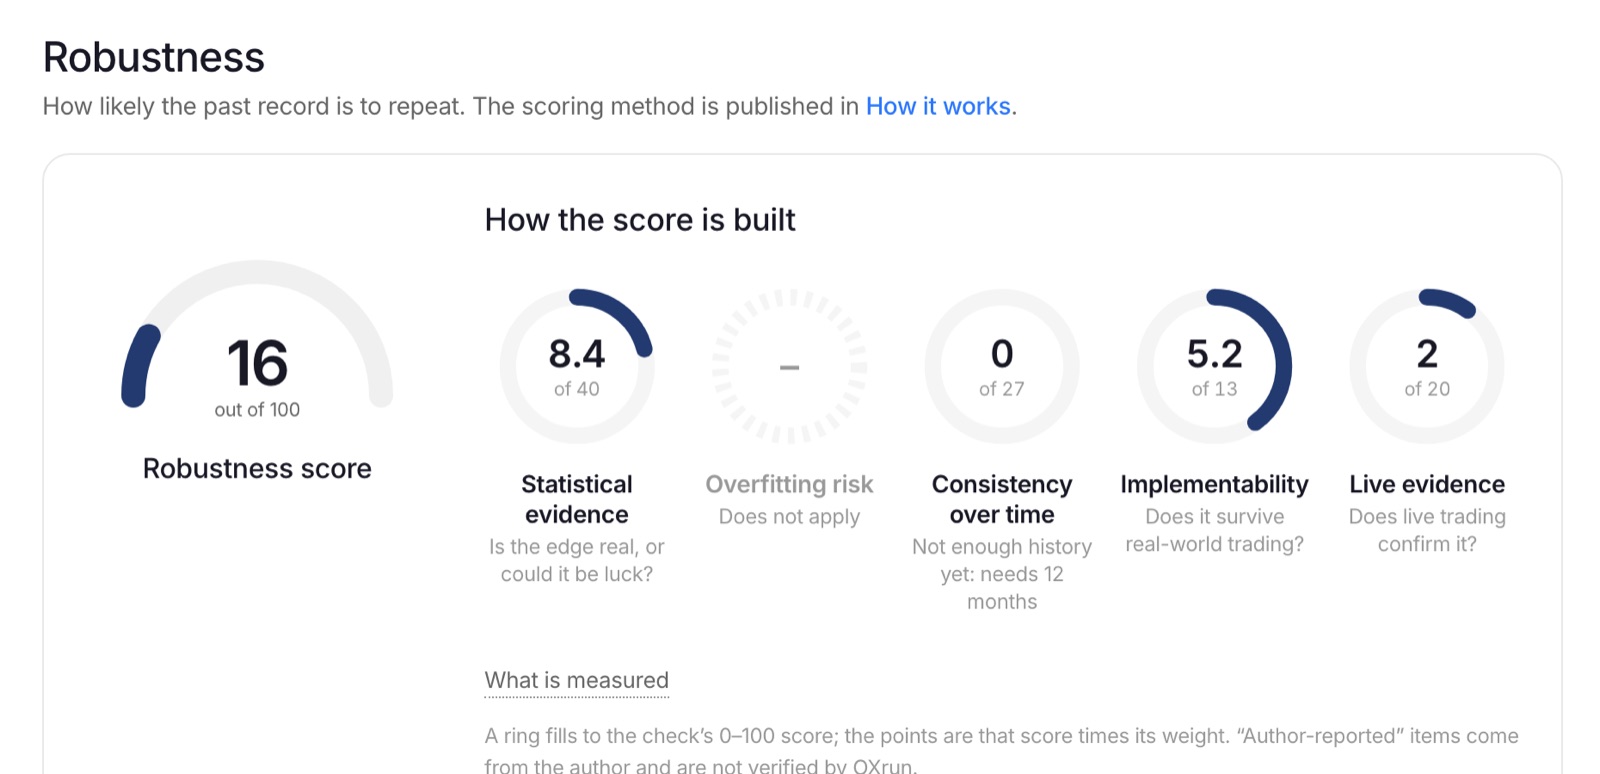
The score shows how likely a record is to repeat, not how high it is. It checks five things.
Statistical evidence
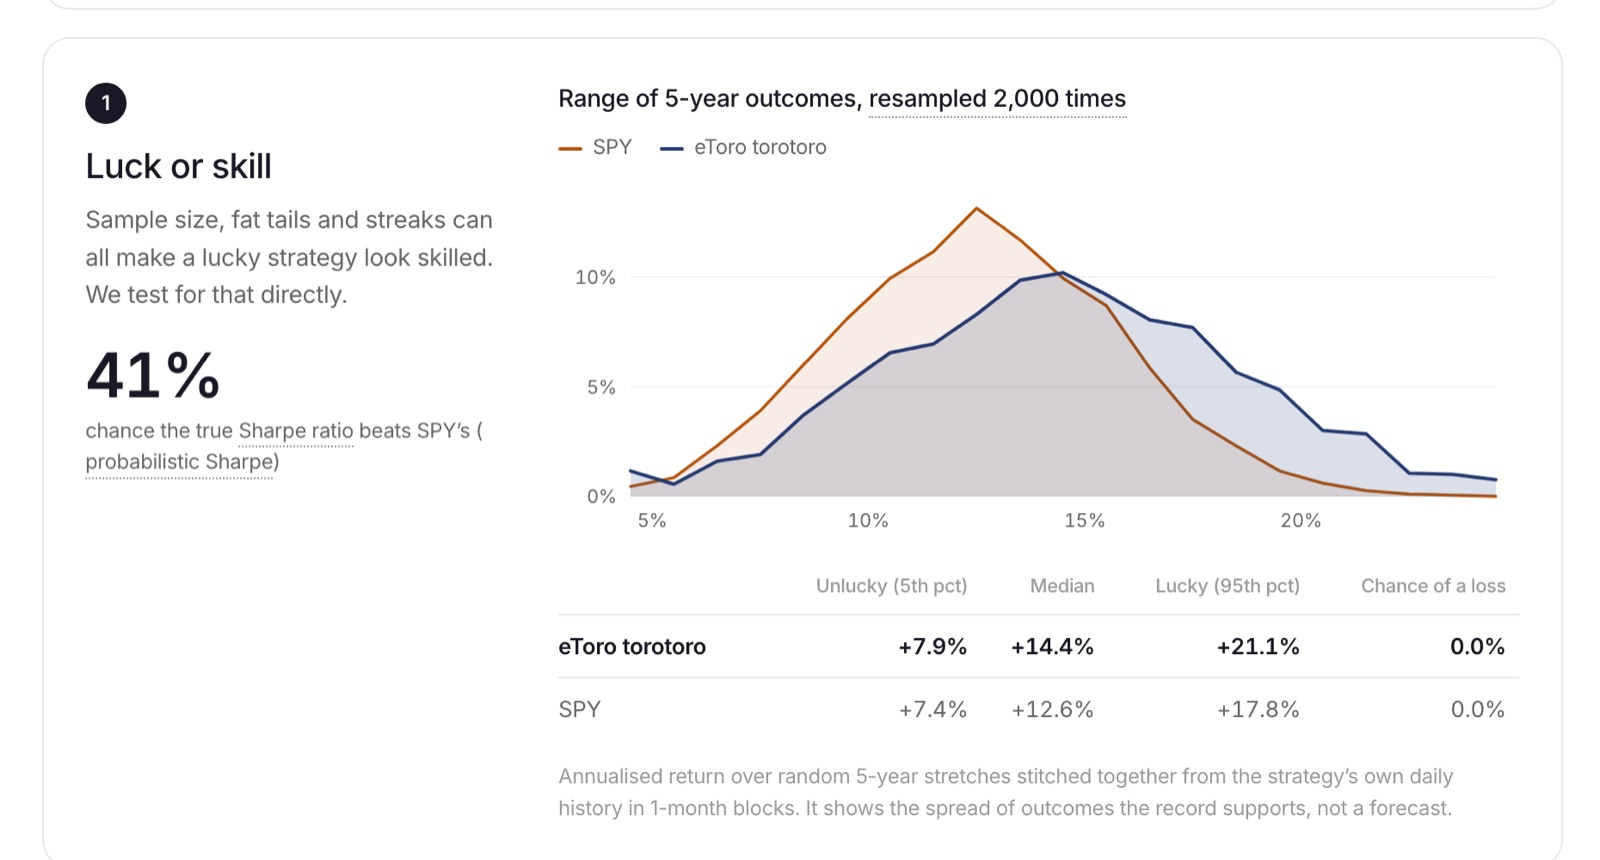
Is the edge real, given the length of the record? Measured with the .
Overfitting risk
Do results hold on data the strategy was not built on ()? This catches .
Consistency over time
Does it work in rising, flat and falling markets?
Live evidence
Real trading counts more. A backtest alone cannot reach the top.
Implementability
Do results hold after higher trading costs and a one-day delay?
One score from 0 to 100
The five parts are weighted as below. Without a live record, the maximum is 85.
30%25%20%15%10%
- Statistical evidence
- Overfitting risk
- Consistency over time
- Live evidence
- Implementability
On every strategy page